In a short explanation, the TED spread is a measure of liquidity and shows the willingness to which banks lend money with each other. A widening difference signals a credit crisis or tight money in the financial market as banks are not willing to lend out money due to higher default risk.
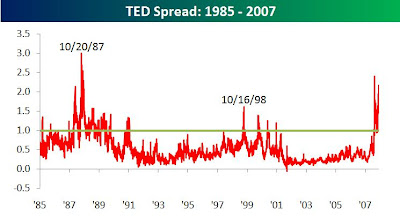
The chart below shows the TED spread over the last twenty years. It is interesting to note that the peaks of the spread are exactly on the day after the previous major crashes in 1987 and 1998. Investors should not rely on the spread as an indicator to crashes but instead should focus on the direction of the spread which signals a recovery in the financial market. From the chart, as soon after the TED spread peaked, S&P index rose with satisfactory returns. The latest peak shows when the sub prime crisis started.

Chart courtesy of Bespoke
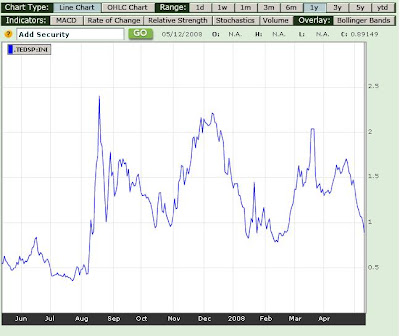
Attached is the latest one year chart of TED spread from Bloomberg. If you see the current spread from the chart, it is near low level and indicates that the worst of the credit crisis that prompted banks to restrict lending may be over. If you want to be certain, probably you can wait till it reaches a difference value of 0.5.

No comments:
Post a Comment